Area Range
Intro
Interpret a range of input values as an area and then remap them to dimensions.
This is useful for creating proportional charts where values are being used to determine the Radius of an Ellipse or the Sides of a Rectangle. For example, if representing population, directly connecting values into the Radius of an Ellipse within a Duplicator would generate a disproportionate visual representation of the data.
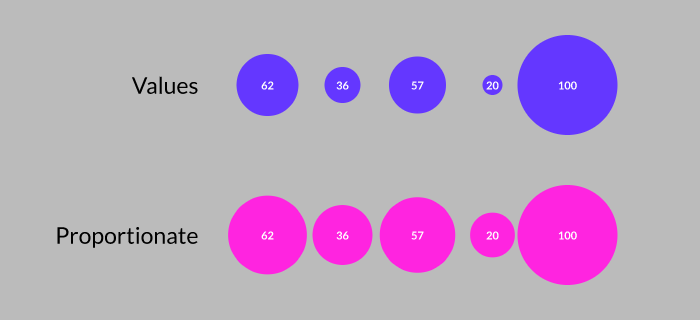
In the image below, when connected directly to the input values (top), an Ellipse with a Radius of 100 has an area far greater than 5x that of an Ellipse with a Radius of 20 but when passed through the Area to Dimensions Utility (bottom), they are proportionately correct — the Ellipse with an input value of 20 is visually 1/5 of the area of the Ellipse with an input value of 100.
UI
Value - Enter or connect an array of values.
Maximum Value - Set a maximum amount for the Value — usually the highest value in the connected set of values.
Maximum Dimensions - The value the Maximum Value is remapped to.
Clamp - When checked, the output will never go above the Maximum Dimensions.
- Create an Ellipse (Option/Alt + click the Ellipse tool)
- Create a Value Array.
- Using the
 button, add 2 more indices to the Value Array.
 - Give each index a value:
0:Value= 341:Value= 202:Value= 100
- With the Ellipse selected, click the Duplicator icon in the Shelf.
- Set the Duplicator's Distribution Type to Linear.
- Set the Duplicator's Size to 500.
- Create an Area Range.
- Connect valueArray.id→areaRange.value.
- Connect areaRange.id→ellipse.radius.
- Set the Area Range's Maximum Value to 100.